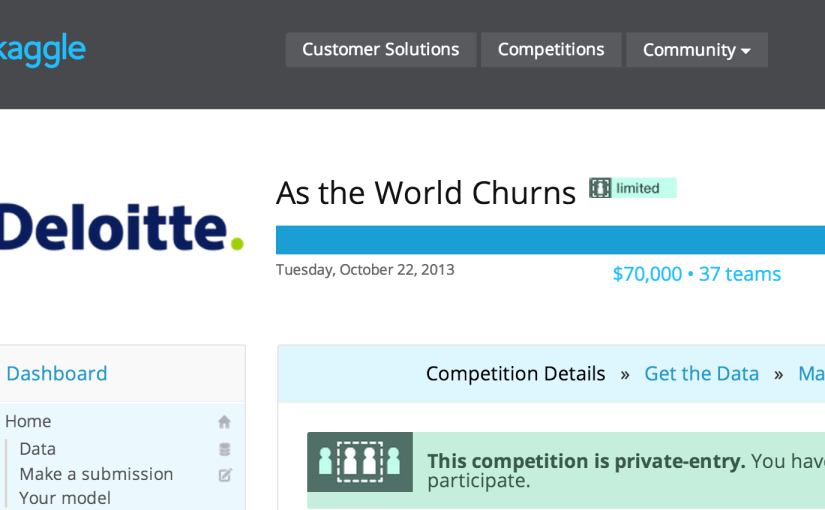
Last December, I teamed up with Michael once again to participate in the Deloitte Churn Prediction competition at Kaggle, where to predict which customers will leave an insurance company in the next 12 months.
It was a master competition, which is open to only master level Kagglers (top 0.2% out of 138K competitors), with $70,000 cash prizes for top 3 finishers.
We managed to do well and finished in 4th place out of 37 teams in spite of that we did not have much time due to projects at work and family events (especially for Michael, who became a dad during the competition).
Although we were little short to earn the prize, it was a fun experience working together with Michael, competing with other top competitors across the world, and climbing the leaderboard day by day.
I visualized our 60 day journey during the competition below, and here are some highlights (for us):
Motion Chart - Deloitte Churn Prediction Leaderboard
Once clicked the link above, it will show a motion chart where:
For the chart, I reused the code using rCharts published by Tony Hirst at github: https://github.com/psychemedia (He also wrote a tutorial on his blog about creating a motion chart using rCharts).
We took a rain check on this, but will win next time! 🙂